So, Brad an I have a long-standing argument (one of many) about whether, if you were to graph the age at which people in America lose their virginity, it would look like a normal Gaussian. Brad says yes. I say no. My argument was, essentially, the graph would be very asymmetrical, with a sharp increase into the peak and a slow deline away from it (the average age is 16...many people lose their virginity at 20 or 21; many fewer at 11 or 12). Brad says that while it's true there's going to be some asymmetry, a normal distribution is still a pretty great approximation, or at least good enough to be useful.
I was reading about recent studies for work (what's new?), and I came across one study on premarital sex in the US. (Finding: The vast majority of people do it. The vast majority of people have been doing it for a really long time). The analysis was based on data from the National Survey of Family Growth, and I realized this survey might be just what I needed to prove my point (or be horribly shamed). Since all of this data is publicly available—if a pain in the ass to access—I was able to download the relevant questions for the women who took the survey: age, whether had sex, and age of first sex. I had data for 6500 nationally-representative respondents in 2002. The graph of number of people who lost their virginity at each age looks like this:
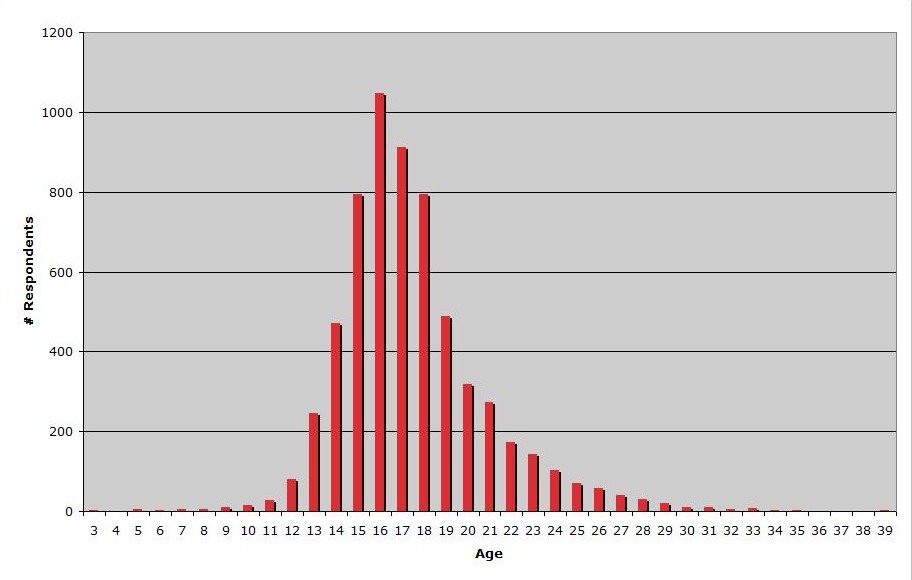
It's a very pretty graph, and it looks more or less as expected (although I'm a little surprised at the sharp drop-off in the 18-20 range). You can see where we're both coming from: It is pretty asymmetrical, and it also looks on the Gaussian side of life. It's also important to note that the data I took was from people aged 20 to 44 at the time of the survey. Therefore everything after age 20 is skewed down a bit.
So I did some fits. First I did the normal fit and it did look decent, but got far too low far too quickly. I did only fit it through age 25 (so the skew wouldn't affect the fit too much), but by age 21 it's already a suck-fest. Then I tried to fit a Poisson distribution. To put it mildly, that distribution doesn't exactly lend itself to Excel curve fitting. I attribute this mostly to the bitchy factorial in the denominator. I also tried to fit the black-body radiation function. Also a mediocre result. Then I had an idea and tried to curve-fit the integral:

As you can see, I got a nice little arctan thing going on there. While its derivative is still a symmetrical function (1/[x^2 + 1]), it seemed to drop off more nicely, so I fit the polynomial A/[ax^2 + bx + c] to the curve. It's not perfect, but it's actually quite a bit nicer than the sharp drop Gaussian. Anyway, here they are: THE FITS!

Light blue is data, red is the Gaussian, yellow is black body, green is Poisson and purple is the inverse polynomial. I still think a more generalized Poisson may make the best fit, but right now I think the inverse polynomial works best. If someone knows a better asymmetrical distribution, please let me know! But the important thing is that at two standard deviations, the Gaussian sucks :-P
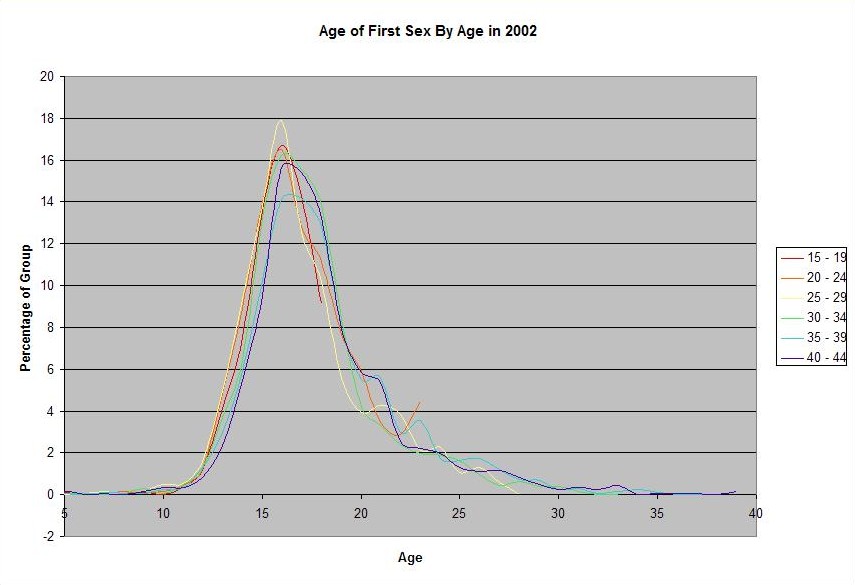
Oh, and if you're curious, here are comparisons for different age groups in 2002. The peaks are a fair bit sharper and a little earlier for the younger groups, but they're all pretty similar:
I hope you've enjoyed the viginity loss post!
Now for some google loading so nobody else has to graph this stuff: virginity loss, age of first sex, america, usa, large sample size, age of first intercourse, age of first sexual intercourse, nsfg, 2002 national survey of family growth
No comments:
Post a Comment